Design Better Websites with Data
Last modified: June 18, 2026

AKA Data-driven web design.
Great designers start with the Why.
Your website looks beautiful, congrats! But does it meet your marketing goals? Is your investment justified in terms of time or money? Are you getting the maximum value for your business from your website?
If you like many others have these questions, read on.
In this article, I am going to show you how to track the data you need to succeed and how to use that data to improve your website and thereby achieve your business goals.
Even before you write your first line of code or do your first mockup, here are some things you must know.
* This button will show the rest of the post and open up an offer from a vendor
1. Setting up a primary goal for your website
” If you don’t know where you are going, any road will take you there. ”
The first step in designing anything well is having a clear purpose for your creation.
Imagine if all a carpenter knows about making a table is that it should have 4 legs and have a flat top surface. We would have many different unusable and useless objects which fit that description.
Unfortunately, this is how many still make a website.
We often hear, “I have a business, everyone says I need a website, so here’s $5,000. Now make me a website.” If you get this often, stop right there and help your client see the big picture.
Every website needs a primary goal. Your primary goal can be:
- Product Sales
- Brand Awareness
- Enquiries/Bookings
Make sure you know your website’s primary goal before going any further.
2. Measuring Metrics
To evaluate the success of your website and to justify your investment, you can only rely on data. So here are the most important data metrics you should measure:
- Website traffic: This is the total number of users, sessions or pageviews you get. You should also pay attention to traffic sources, demographics and traffic growth over time.
- Bounce rate: Bounce rate is the percentage of people who leave your website right after arriving at your landing page. ( without visiting any subsequent pages ).
- Avg time spent on site: Time spent by a user in a single session.
- Conversion rate: The percentage of users who perform the primary goal of your website ( like purchase, book or enquire ).
- Cost of Acquisition: The cost (mostly money) of acquiring a single customer based on money spent on advertising/marketing channels.
Google Analytics helps you get all these data instantly. You just have to add the Google tracking code somewhere in your website’s code, and Google Analytics tracks your metrics and displays them in a visual form on your dashboard.
To setup Google Analytics’ tracking code on a WordPress website, you can use a Google Analytics plugin. And you can use WP Google Analytics Events plugin to track events. Another option is to install Google Analytics all on your own.
Heatmaps:
Heatmaps give you a visual map of your user’s activity on your website. You can see where your users click or scroll in your webpage. This can be a handy tool to find usability issues on your site.
Crazyegg is an excellent, free and straightforward heatmap tool.
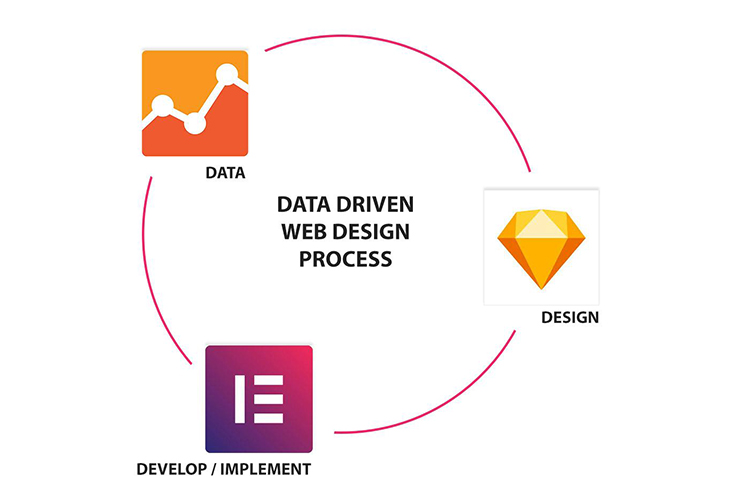
3. Design Process:
I recommend a three-fold design process. This is designing with three important and different perspectives.
4. Modular Design
Have you found yourself with a client who demands frequent changes and you end up doing dozens of mockup versions for pretty small changes? Have you found yourself changing something minor like fonts/colors and ending up creating files like ‘final.jpg’, ‘final-2.jpg’, etc. ?
That’s the exact kind of time waste you could avoid by going with a modular design approach. Won’t you like to change a font in one place and have it update everywhere relevant or adjust the padding of an entire grid of elements in one go? Using SketchApp or Adobe XD, you can achieve precisely this elegant, simple and time-saving workflow.
Here’s how you can use Adobe XD’s layers to create modular components of your webpage.
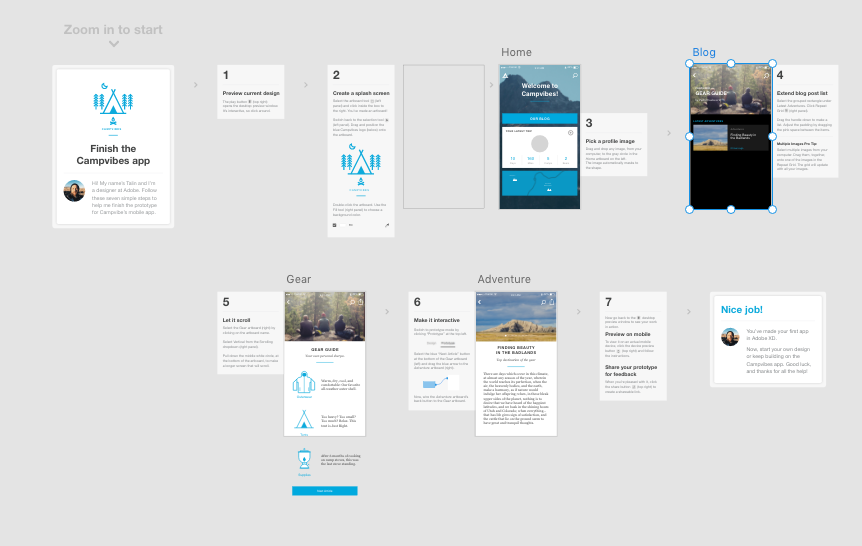
These images show the way you can arrange different webpage mockups or mockups of the same page for various devices.
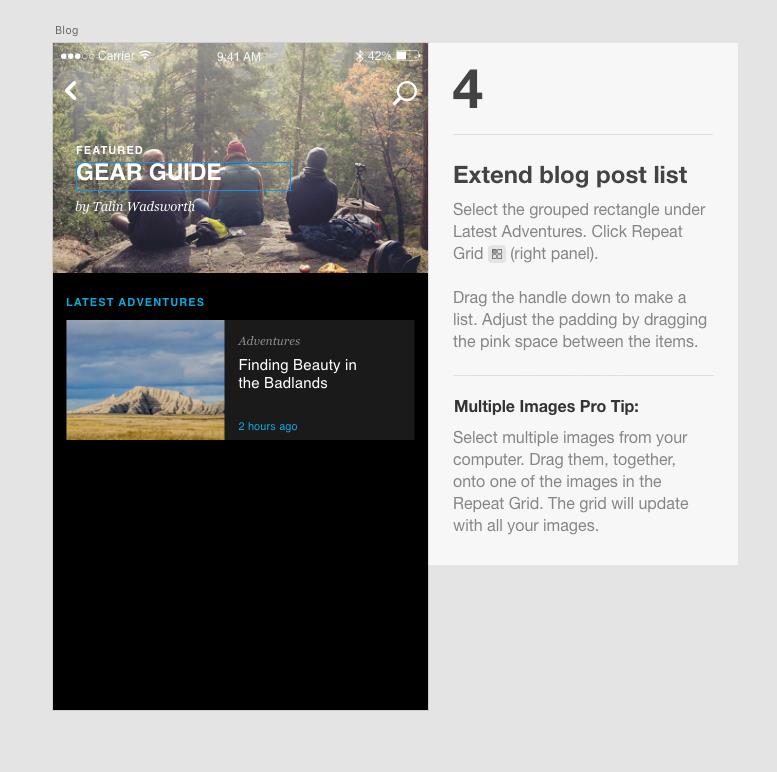
Using the Repeat Grid feature, you can also create a single component and duplicate that many times like this:
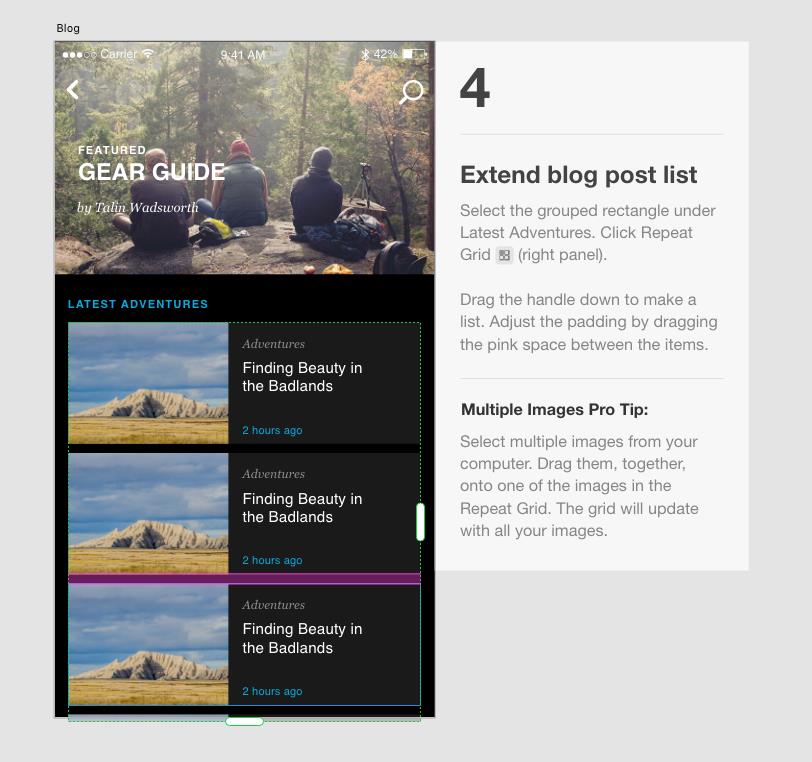
This is incredibly useful to change the properties of multiple elements of the same type in one go.
This is the kind of robust, modular design that is possible with Adobe XD or SketchApp.
5. Iterative Design
Iterative design or iterative design improvements are crucial for designing with data. This is how it works; you get feedback from your client but more importantly from the analytics data tool. Then you use this feedback to improve your design.
Always focus your design improvements primarily on improving your core metrics from your Analytics data.
Say, if your core metric is time spent on your website. Then, think of what relevant content or link to a page you can place on your homepage that would increase the time spent.
Or if your core metric is Conversion Rate, then you might have to improve your user’s flow from landing page to the conversion action.
Here’s an example of using a heatmap to increase the time spent on your website and decreasing the bounce rate:
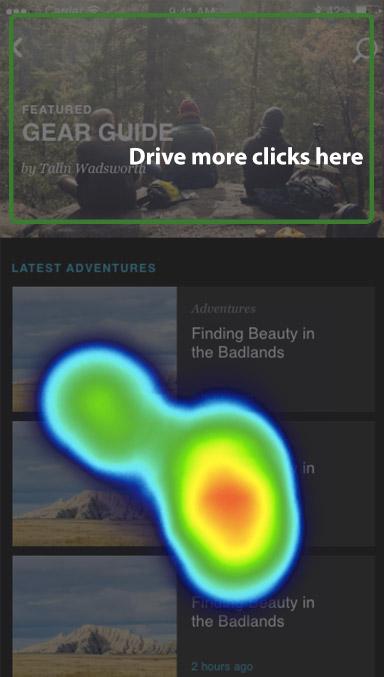
This is the heatmap of the webpage from our earlier mockup. And you can see that the featured image is not getting the attention it should. So how do we fix it?
The problem could be that people might not be aware that the featured portion is clickable. They could also easily mistake that for a simple hero banner. So, here’s a simple fix:

Yes, it’s that simple. Just adding a button and having a call to action to read more, makes people take that action.
So, that’s more people clicking on your featured post and more people reading. Now, more people spending more time means fewer people exit after landing on your website.
We have now managed to increase the Time Spent on Website and decrease the Bounce Rate.
6. Designing for conversion:
Using modular and iterative design techniques, focus on improving the conversation rate of your primary goals. To design for conversion, understanding how your users go from landing on your homepage to taking the primary goal action is crucial.
Different conversion goals have a different user flow. Here is a basic user flow model for an E-commerce conversion:
- Awareness: How your users hear about you.
- Solution Validation: When they come to your website, do they think it solves their problem.
- Social Validation: Do other people use this product and what do they have to say about it.
- Trigger to take action now: A trigger that helps the users make a decision now.
- Purchase: The final action of purchasing your product.
7. Development Process:
A development setup that allows quick and iterative deployment of design changes is essential for you to implement your data-driven design fast. Assuming you are already using WordPress for all your websites, let me first introduce a WordPress plugin that would help in getting your designs implemented fast.
Elementor Page Builder plugin
Elementor is by far the simplest and quickest page builder out there. Elementor makes it super easy for you to implement your design changes with a visual editor. You can also save modules and templates.
This makes it the ideal tool in our Iterative Modular design.
BONUS: Another important metric to optimize for:
Here’s another important metric that would affect your SEO, conversion and most importantly, your bottom line.
Page Speed:
According to a KISSMetrics report from gomez.com survey, around 40% people leave a webpage if it’s still loading after 3 seconds. Also, if your website makes $10,000 per day, you could lose 7% of that for every 1-second delay, that’s $2,100 for a 3-second delay.
Put another way; you could improve your revenue by 21% by improving your loading time by 3 seconds.
You can use the GTMetrix tool or even the Google PageSpeed Insights tool to analyze your speed issues and fix them.
Related Posts


 Website Maintenance – Use Promocode: scanwp
  Advanced JetPlugins for Elementor
  Semrush 14 days trial
  Kinsta – Managed WordPress Hosting
  Bluehost Hosting